

Happy February!
It has been an uneventful year so far. If you crowd out the noise and just look at the markets in a vacuum, it is not exciting.
The market continued its momentum from the end of 2024, with the S&P 500 pushing to new all-time highs in mid-January almost reaching 6,200 with a gain of about 2% year to date. There is still pressure from valuations and technical indicators which pulled the market back to 6,050.
It’s always interesting to see how the Magnificent 7 has performed against the other 493 as well.

The 10-year Treasury yield is slightly down for the year, currently hovering around 4.5%, reflecting persistent inflation concerns and market expectations for rates to stay higher for longer. Of course, the 10-year had a spiked in January, but fell shortly thereafter.

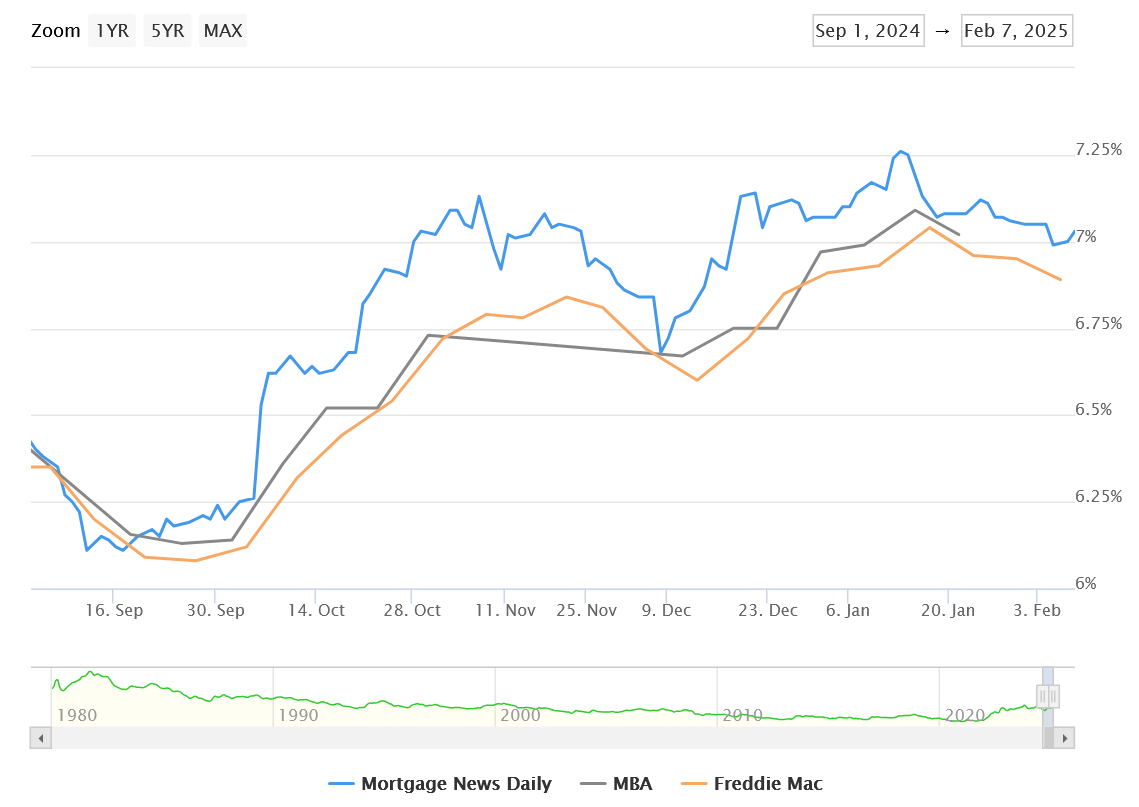
The housing market continues to show sensitivity to elevated rates, with mortgage rates hovering just around 7% for 30-year fixed mortgages, contributing to ongoing affordability challenges in the residential real estate market.
Chart below is from Mortgage News Daily.
For now, we are watching the Federal Reserve's next move in case of any surprises. The strength of recent economic data, particularly in employment, has made it quite apparent that the Fed will pause its rate cuts. This environment makes it relevant to examine how the fixed income markets price in risk and what opportunities might exist across the credit spectrum.
That brings us to our focus point of this month’s market update which is credit spreads and the bond market in general.
Let’s start with a fundamental breakdown of how bond rates are calculated and then move to the spreads and what they tell us.
Understanding How Bonds Price Future Risk
When we talk about bonds and interest rates, we're really discussing how the market prices future uncertainty. At its core, a bond's yield represents two fundamental components:
The time value of money
Compensation for risk.
The U.S. Treasury yield curve serves as the baseline, representing the "risk-free" rate. What's fascinating is how this foundation then helps us understand every other fixed income instrument in the market.
Think of bond pricing as a forecasting mechanism. When you see a 10-year Treasury yielding 4.5%, that's not just a random number – it's the market's collective wisdom about:
Future economic conditions
Inflation expectations
Monetary policy
This baseline then becomes crucial for pricing everything else in the fixed income universe.
For example, when we look at mortgage rates we see they are at about 7% and 4.5% for the 10-year. The difference between the two is 2.5%.
What is the 2.5%? Well, that’s the spread.
Why does the spread exist? Because there is an “extra” 2.5% of risk built into mortgage rates.
The 2.5% includes default risk, prepayment risk, a lender profit margin, and more. This is a simple way on how treasuries impact other fixed income products.
The Credit Spread Spectrum: Risk and Reward
The world of credit spreads is like a layer cake of risk, each layer representing a different level of credit quality and corresponding reward. Let's break down these layers: