

2025 is off to an interesting start! We have had intriguing economic data coming to the forefront in the past month.
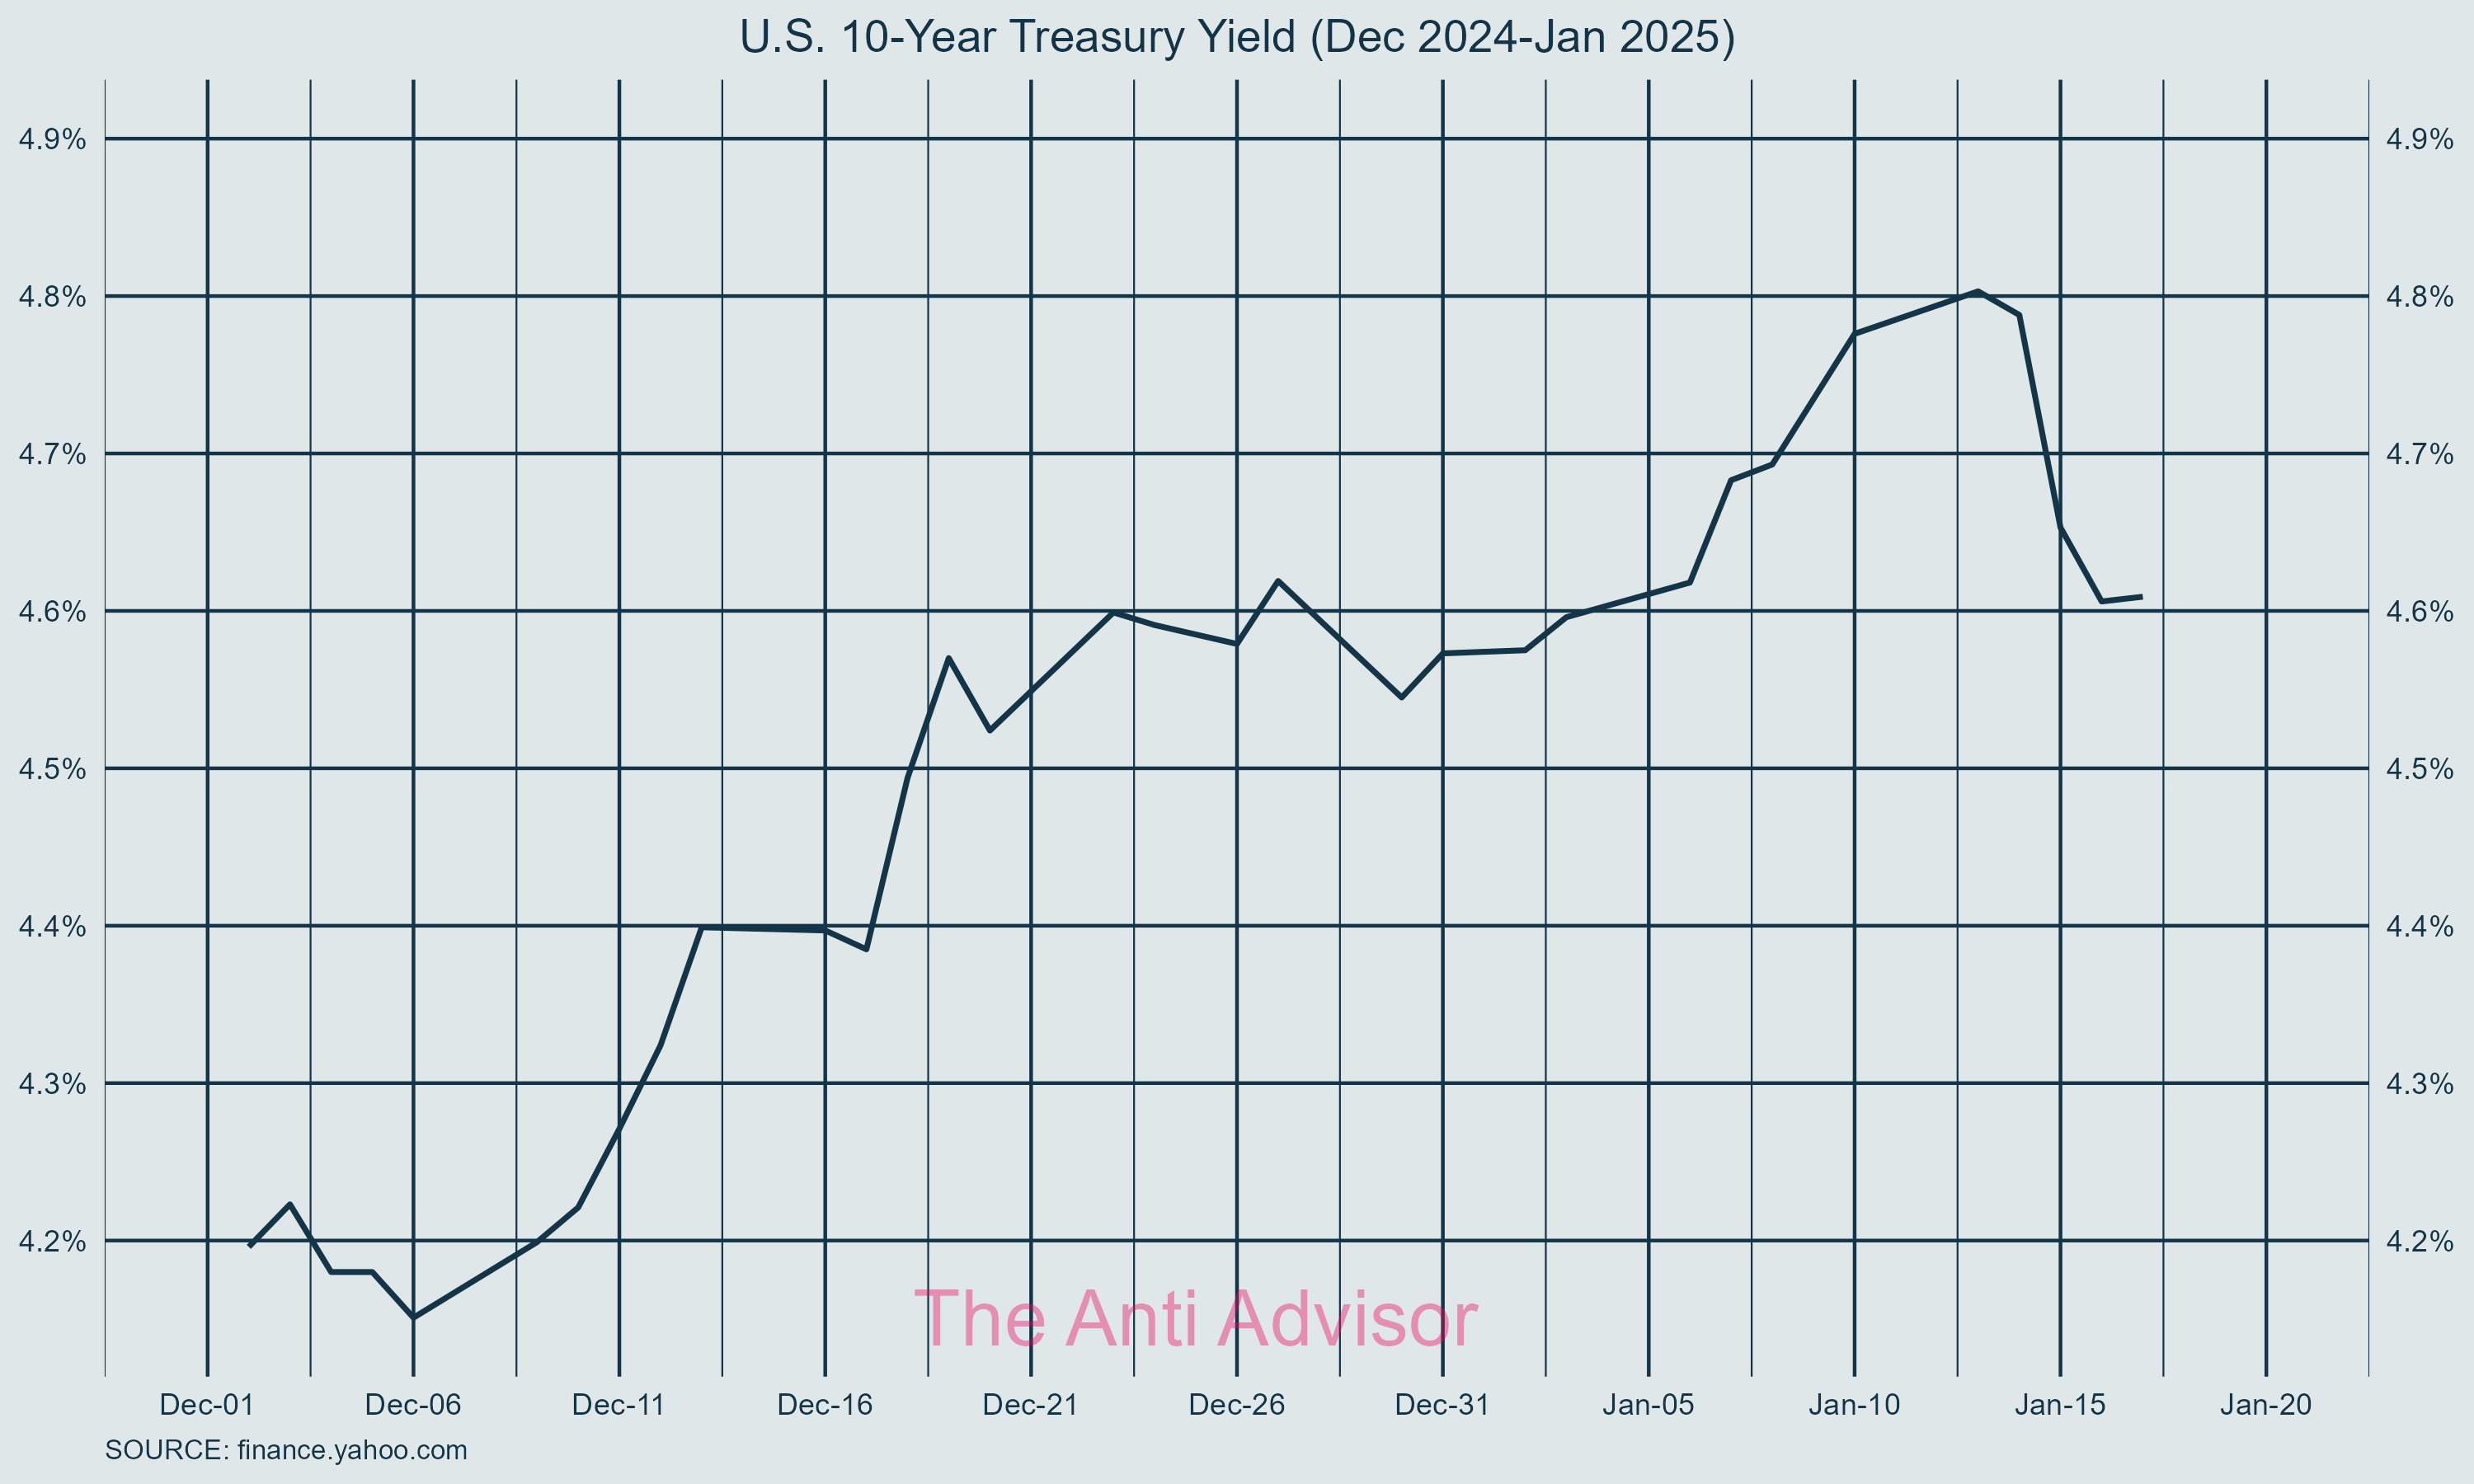
First, let us begin in December with the decision to cut rates. The 10-year treasury did not agree with the cut as it rallied higher to 4.80% from 4.18% in about 30 days. To clarify, the Fed does not have absolute influence over long term rates. Their influence is over short term bills. Having long term rates rise this quickly can put significant pressures on mortgage rates and investors’ future expectations of the economy. That does take some time however.
For a quick refresher on the 10-year treasury, it is auctioned through a process where investors bid on newly issued 10-year treasuries. Their bids will create the rate through market sentiment and risk factors:
Future expectations of inflation
Economic growth
Monetary policy
Investor confidence (sentiment)
Continuing 10-year treasury rate increases will have significant impacts on the housing sector and overall economy if they continue to rise. It is also worthy to note that 90% of fixed income managers have never seen a rising interest rate cycle or stagflation.
With rates out of the way let’s turn our heads toward unemployment and inflation. It was a wild ride with the unemployment numbers decreasing only a small amount. This sent markets falling because investors thought the Fed had made a mistake with the rate cut. Investors thought it was premature, and inflation expectations started to increase in early January. However, we soon found out that the inflation expectations were put on hold.
CPI numbers came in cool the week of January 13th
Markets rallied
10-year treasury fell to a modest 4.65%.
Upcoming economic data releases and events I will be focusing on is, of course, the Fed rate decision at the end of January. I would have liked to see them pause their rate cuts in December but the likely hood of future rate cuts in the first half of 2025 is low as inflation is still a concern.
Fed decision happens on Wednesday, January 29th .
On January 30th, GDP growth rate releasing for Q4 2024.
Speaking of data, I think we will begin to get a more accurate picture of the economic and jobs data releasing in 2025. My opinion is that the data has been skewed in a way to make the overall picture look brighter for political reasons. Numerous data points have been revised in the past 1-2 years with the most significant being the 800,000 job revisions report back in August of 2024.
Either its incompetence or lying. In fact, it’s probably both, but weighted towards the latter.
As a reminder, my approach is long-term investing and not politically driven. It’s important to stay updated on these data points but I would need to see significant changes in the economic landscape before I make any allocation changes.
Currently, I am well positioned to take advantage of any rate cuts or equity volatility and remain that way for the first quarter. If allocation changes are made, I will send an email to our PREMIUM members a few days before I make the allocation change.
For now, I would like to focus this week on debt levels and how we can see debt through different lenses. I’ll go over 5 relevant graphs with the first being the Debt-to-GDP ratio.
Debt-to-GDP ratio.

This ratio compares the US Federal Debt to its Gross Domestic Product (GDP). It's a key indicator used to gauge our ability to pay back our debt. Lower ratios suggest we can withstand or grow out of its debt, while higher ratios might indicate potential difficulties in debt management.
We must look to history to understand how sustainable this is and for now, it seems to be a bit out of the normal range. This can not last forever and something must be done to curb the spending or have GDP rise significantly.
The next four are a bit more eye opening!